Plunkett’s Corporate Benchmarks & KPIs Reports
Deep Industry-Specific Benchmarks, Statistics, Financials and Market Sizing Forecasts. Choose from 500+ industries. Updated and republished frequently.
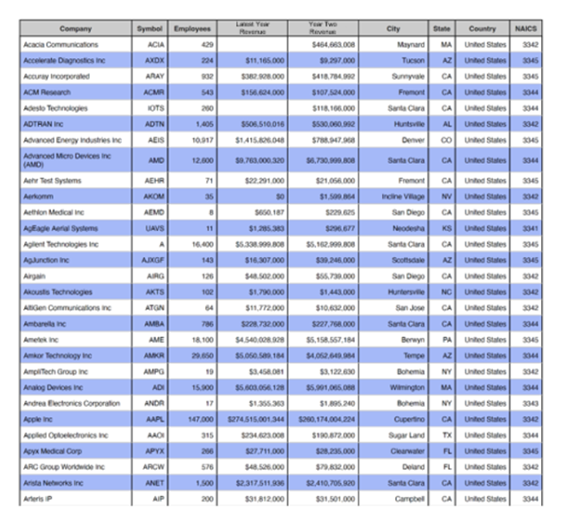
First, search for your company of interest
from 4,000 different companies
Corporate Benchmarks/KPI Reports Available on 4,000 Different U.S. Public Companies — Benchmarked Against their Industry Peers. UPDATED YEARLY.

We solve data needs!
I Need to Compare a Company’s Financials to its peers and industry
Multiyear History and Benchmarks on your choice of 4,000 different companies
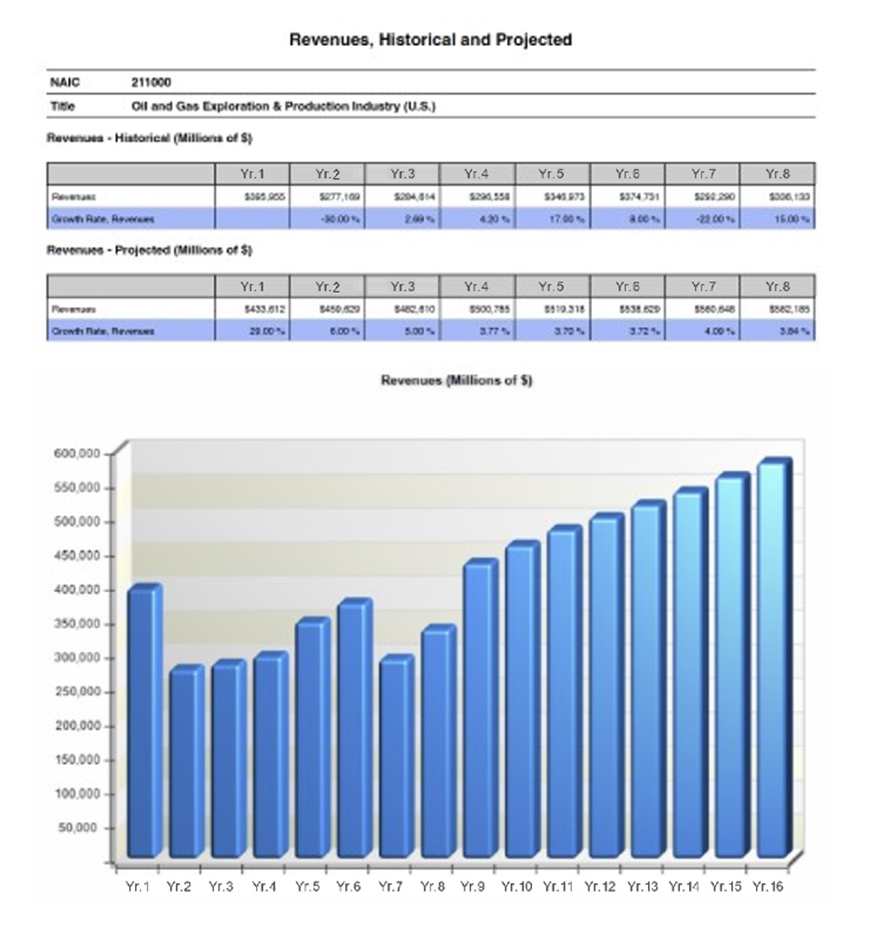
I Need Market Size Forecasts
7-Year Forecasts
I Need Financial Metrics, Averages and Operating Ratios
Complete Financial Metrics & Analytics
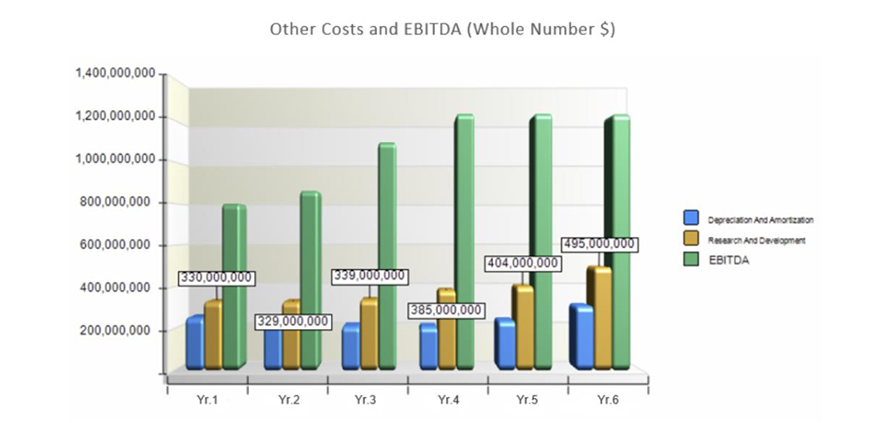
I Need Profit Margins and EBITDA
Profits, Margins, COGS, EBITDA
I Need Benchmarks for Top Firms
Top Firms Analyzed and Compared
I Need Historical Income Sheet, Cash Flow and Balance Sheet Averages for this company and industry
Your target company has been benchmarked against our massive data sets, creating an extensive financial report
Each 60 to 70 Page Report Starts With an Industry Summary, Historic Data and Forecasts

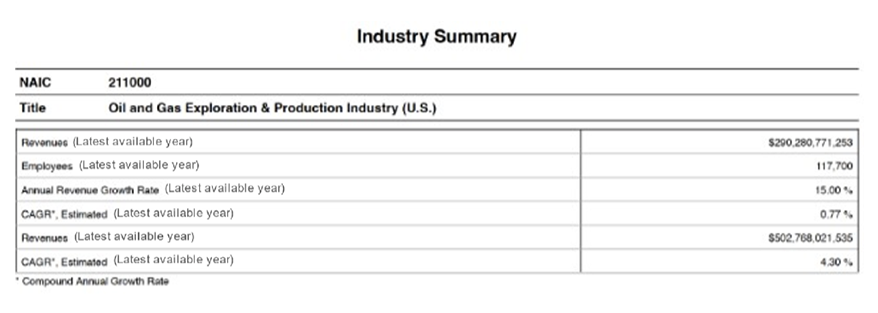
Deep Data
Multi-Year Financial Averages for the Industry’s
- Income Statement
- Balance Sheet
- Cash Flow Statement
- A Complete History!
Historic EBITDA
Deep Benchmarks and Operating Data For the Company You are Studying
The data sets include:
- I. Top Companies Ranked Within the Industry Ranked for Key Items
- Approximate market capitalization
- Employees
- Revenues
- Net Income
- 3-Year revenue growth (%)
- 3-Year income growth (%)
- Return on assets (%)
- Return on equity (%)
- Return on invested capital (%)
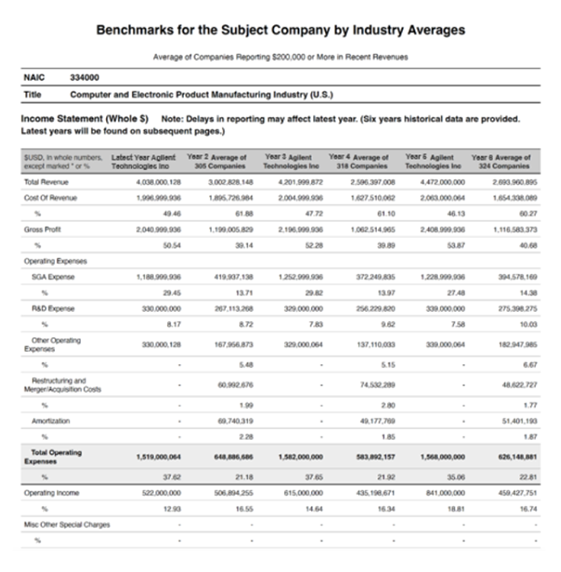
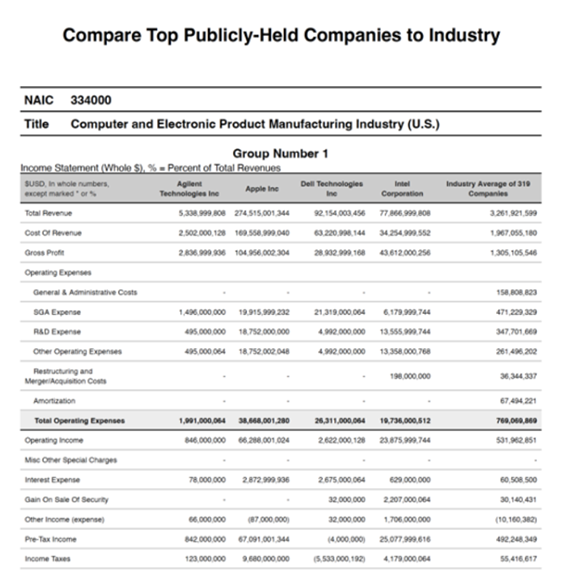
- II. Benchmarking of the Subject Company and the industry’s Leading Firms, to Each Other and to their Industry’s Averages
- Benchmarks include income statement, balance sheet and cash flow items for each company, latest year
Top Companies Ranked
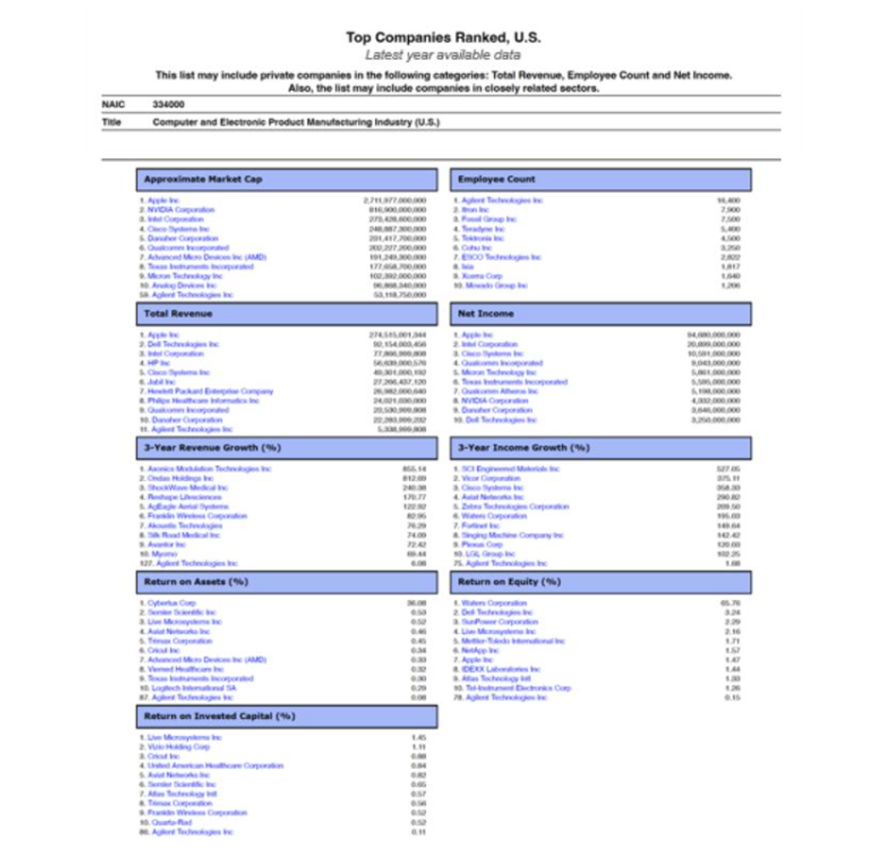
Includes a List of Companies Used for Industry Averages
Superb Company Reports Save you Countless Hours of Research
Top Competitors Compared to Each Other and to the Industry Average
- Income Statement
- Balance Sheet
- Cash Flow Statement
For the Subject Company and Industry's Top Firms
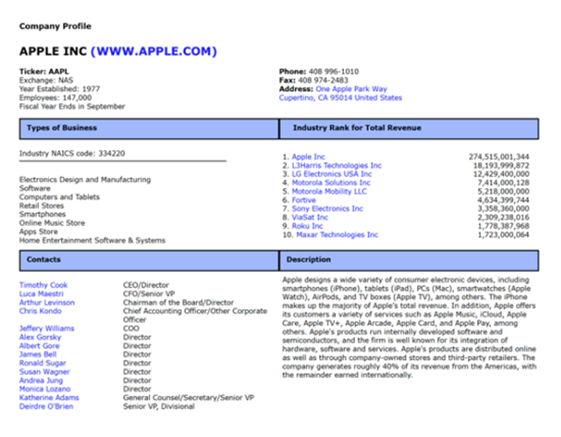
- Company Profile
- Leadership
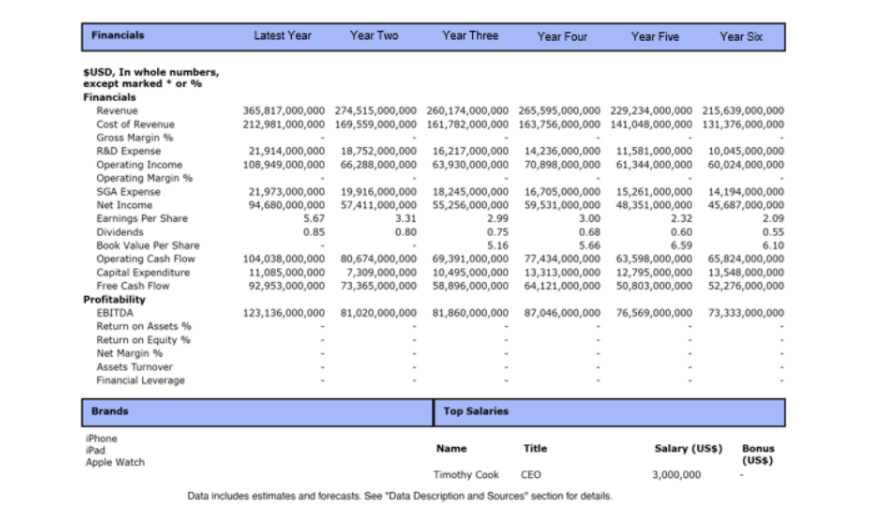
- Historical Financials
- Business Discussion
6-Year Financial Summary for each Top Firm
Users of our Data Include the World's top Consultancies, Corporations and Investment Firms
Plunkett’s Corporate Benchmarks Saves You Countless Hours of Effort and Solves Unique Data Needs for Specific Types of Buyers
Banks and Other Lenders

M&A Advisors and Appraisers
Professionals at Investment Banks
Consulting and Accounting Firms
Private Equity Firms
Analysts, Hedge Fund Professionals
VP of Strategy Needing Deep, Industry-Specific Data
Reports Available for Thousands of Companies Within Vital American Industries
Firms Covered by these Reports Include All Industry Sectors. Updated and Republished Frequently.

 Download Corporate Benchmarks Brochure